Nemanja Živković, Strategy Director, Founding Partner · 10 November 2026
Direct Traffic Is an Echo
The channel report says direct is your best source. It is the sound of money you spent three months ago coming back. How to read it, plus the three other lies last-click tells you.
I am writing this the week I speak at a brand conference in Sofia, and the talk I am giving has a slide that started as a mistake in one of our own reports. The mistake is common enough that I want to walk through it here, slowly, because once you see it you will find it in every channel report you have ever read, including the ones that made you cut a budget you should have kept.
In June one of our reports went to a client with a line that said, more or less, that direct traffic was their strongest channel. It was true in the sense that the number in the direct row was the biggest. It was false in every sense that matters, and I caught it in review, an hour before it would have gone out. Direct traffic is an echo, and the row that calls it a channel is mislabelled. It is people who already know you typing your name into the address bar, and the question the report should have asked is how they came to know you in the first place.
What “direct” actually contains
Open any analytics tool and look at the row labelled direct, or “(direct) / (none)” if you are in Google’s world. The label makes it sound like a source. In practice it is a bucket for everything the tool could not attribute. Someone types your address. Someone clicks a link in a PDF, a desktop email client, a chat app that strips the referrer. Someone taps a bookmark. Someone opens a tab they left open a week ago. All of those land in direct.
Now ask where those people came from. Nobody types the address of a company they have never heard of. The person who bookmarked you found you first, and found you through something: a search, an ad, a post, a referral. The person clicking from a chat app was sent the link by someone who found you through something. Direct is the second visit, or the fifth, of a person whose first visit was paid for by a channel that got no credit for it.
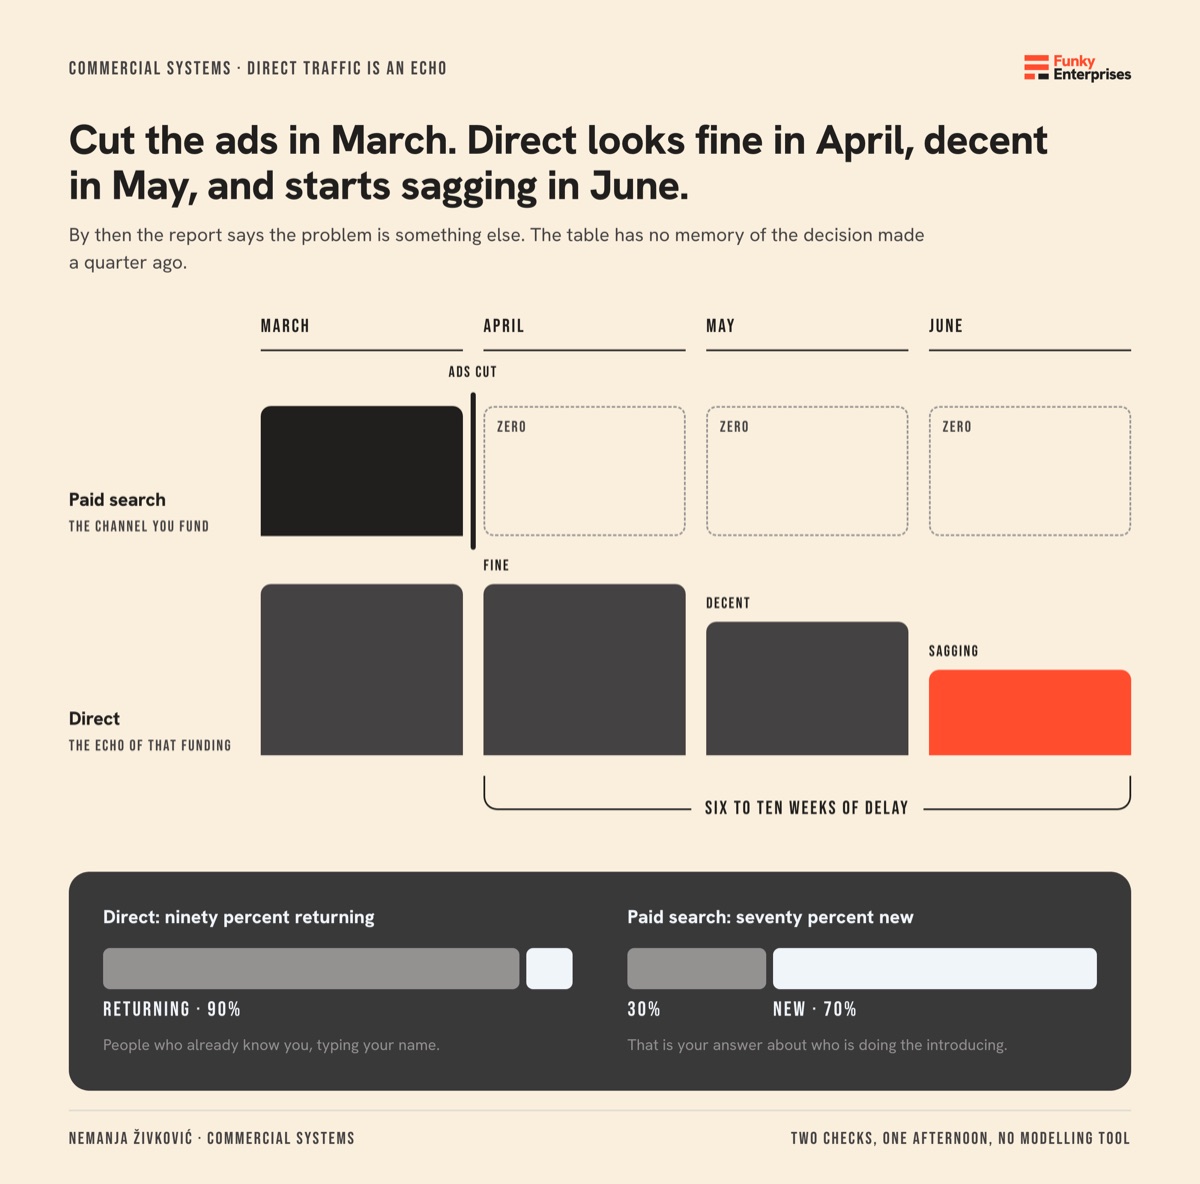
For most of the companies we work with, the honest reading is that direct is mostly returning people who were first brought by ads or search. If ads and search are the two channels you are actively funding, then direct is the echo of that funding, delayed by however long it takes a person to go from first visit to typing your name. And the delay is the trap. Cut the ads in March, and direct will look fine in April, decent in May, and start sagging in June, by which point the report will say the problem is something else. Seasonality, maybe. A competitor. The site. Anything except the decision made a quarter ago, because the table has no memory and the person reading it usually has less.
I have watched this cycle run more than once, and each time the ads were switched back on eventually, at which point direct recovered on the same delay, and nobody connected the two events because they were four months apart and in different reports.
The report that got it wrong
The report I mentioned had a channel table with direct at the top, paid search second, organic third. The paragraph under it recommended, reasonably enough given the table, that the client consider shifting budget from paid toward whatever was driving direct. The client’s marketing lead would have read that, nodded, and asked us to find out what was driving direct so they could do more of it.
The answer would have been: paid search. The thing the paragraph proposed cutting was the thing feeding the row it proposed growing.
We rewrote the paragraph. The channel table stayed in the operational report, because the numbers are the numbers, but under it we wrote what direct is, in one sentence, and that any change in paid should be expected to show up in direct with a delay of six to ten weeks. In the CEO version, which I wrote about last Friday, the channel table does not appear at all. The CEO gets money in, money out, and the note that the two funded channels together account for the majority of what comes in, including the part that arrives late and unlabelled.
The reason I am telling you about a mistake in our own report and not one I found in somebody else’s is that I want to be honest about how easy this is to get wrong. The table makes it wrong for you. It lays out the channels as if they were parallel and independent, and they are neither.
Last-click is a caveat
The table is built on last-click attribution, which credits the whole visit to the last thing the person touched before arriving. It is the default in most tools, it is simple, and it is the wrong model for any business where a person visits more than once before buying. Which is every business selling something that costs more than a coffee.
I do not say last-click is useless. It is the only model where every number reconciles and nobody can accuse you of making up the weights. What I say is that last-click is a caveat, not a benchmark. When you present a channel table, the caveat goes next to it, in the same font size, and it says: this credits the last touch, so the channels that start a relationship are undercounted and the ones that finish it are overcounted. Direct is the extreme case of a channel that only ever finishes.
If you want a fairer view without buying a modelling tool, do two things. Both take an afternoon and neither requires anything you do not already have in the analytics account. First, look at new versus returning within each channel. If direct is ninety percent returning and paid search is seventy percent new, you have your answer about who is doing the introducing. Second, look at the monthly trend of direct against paid and organic with a lag. Plot paid spend, then plot direct two months later. If the shapes rhyme, direct is an echo, and you have a number for how long the echo takes.
The three other lies
Once you accept that the channel table is a caveat, three other things in it start to look different. I am putting them here because they come up in almost every report review we do, and because two of them cost companies real money every month.
The first is brand bidding. Someone will look at the search campaigns, see that a chunk of the spend goes on the company’s own name, and say we are paying for clicks we would have got anyway. Sometimes that is partly true. But the reasoning that follows, that brand bidding is “defensive”, a tax you pay so competitors cannot sit on your name, is the wrong frame, and it leads to the wrong decision, which is to bid the minimum and resent it.
Brand bidding is strategic. It controls the first thing a person sees when they search for you, it lets you send them to the page you want rather than the one the algorithm picks, it gives you a clean test of message and offer with the warmest audience you have, and it feeds direct, because the person who clicked the brand ad today is the one typing your name next month. The company that treats it as a tax bids the minimum and gets the minimum. The company that treats it as a lever puts the same energy into the brand campaign as into anything else and finds it is usually the most efficient thing in the account.
The second is the match type question, which is technical, but it hides a strategy mistake. Older playbooks say to build one ad group per keyword, so that every ad matches its search term exactly. The tools have moved on. Exact match now includes close variants, misspellings, plurals, and reorderings, so the one-keyword-per-group structure gives you fragmentation without control. What works now is grouping by theme, a handful of tightly related terms per group, and letting the platform match within the theme. Anyone still building single-keyword groups is fighting the machine with a map from five years ago.
The third is the conversion count itself. If the client counts a submitted form as a lead, then a phone click is not a lead, a page view of the contact page is not a lead, and a chat opened and abandoned is not a lead. Platforms count all of those as conversions if you let them. Half the “improvement” I have seen in channel reports was a conversion definition quietly widening. Write the definition down, date it, and put it in the footer of every report so nobody can move it without leaving a trace.
Why this belongs in a newsletter about commercial systems
I keep this newsletter on one topic, which is the commercial system: positioning, marketing, sales and customer success as one machine, with a number at each seam. The channel table looks like it belongs to marketing alone. It does not.
The way you read direct decides where the company puts money. Read it as a source, and you cut the channels that feed it and grow nothing. Read it as an echo, and you understand that the funded channels are doing two jobs, the visible one and the delayed one, and you fund them for both. That is a positioning question as much as a marketing one, because the strength of the echo is a measure of how memorable you are. A company with a sharp position gets a loud echo: people come back on their own. A company with a vague one gets a quiet echo, and has to pay for every visit twice.
And it is a sales question, because the sales team lives on the echo. The person who books a call after typing your name is the one who saw the ad, read the post, checked the site, told a colleague, and came back. If the report says that person came from direct, the sales team learns nothing about what made them come, and cannot ask for more of it.
What to do with your own report
Take the last channel table you saw. Find the direct row. Then find the two rows for the channels you actually fund. Write, in one sentence under the table, that the first row is mostly the delayed return of the other two. That sentence changes the decision the table leads to, and it is the sentence most reports leave out.
Then look at the brand campaign, if there is one, and ask whether it is being run as a lever or paid as a tax. And look at the conversion definition and ask whether it has moved since the last time somebody wrote it down.
I am going to say a version of this on stage this week to a room of people who work in brand, and the point I want to leave them with is the one I will leave you with. The channel table does not measure a brand. It hides one, in the row labelled direct, and the only way to see it is to stop reading that row as a source.
One question. When did direct last go up or down in your report, and did anyone in the room ask what had happened two months earlier?
Written by
Nemanja Živković, Strategy Director and Founding Partner at Funky Enterprises. He builds commercial systems for B2B companies: positioning, marketing, sales and customer success working as one. More about Nemanja · nemanjazivkovic.co
Also published in the Commercial Systems newsletter. Read it on Substack